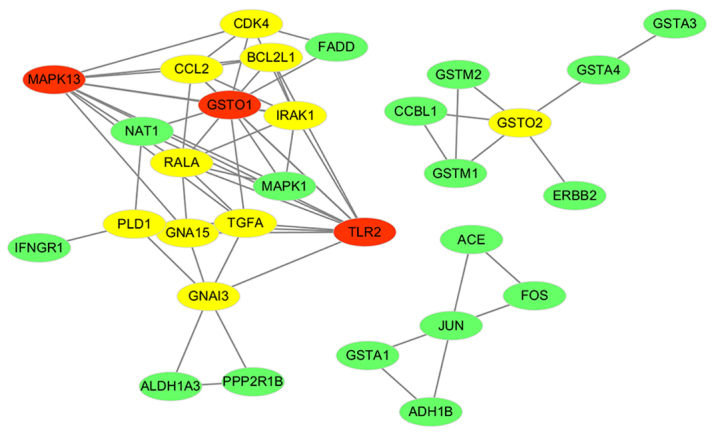
Figure 4.

Co-expression network of genes was based on the Chagas disease and Chemical carcinogenesis pathways. The Spearman coefficient of all edges in this network was >0.95. The hub genes are indicated in red and yellow. Red nodes have a higher degree of connectivity than yellow and green nodes.
