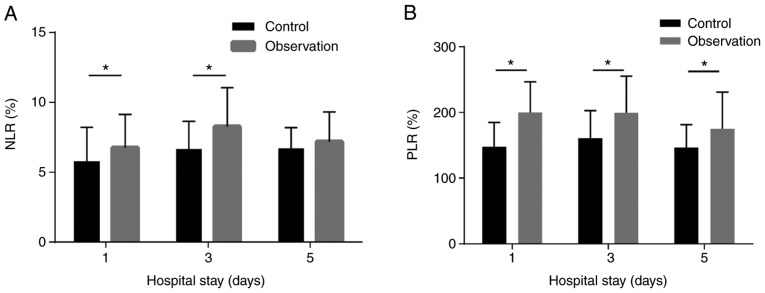
Figure 1.
Comparisons of NLR and PLR. (A) The NLR in the observation group was significantly higher than that in the negative control group on the 1st and 3rd day after admission. (B) The NLR in the observation group was significantly higher than that in the negative control group on the 1st, 3rd and 5th day after admission. *P<0.05. NLR, neutrophil to lymphocyte ratio; PLR, platelet to lymphocyte ratio.

