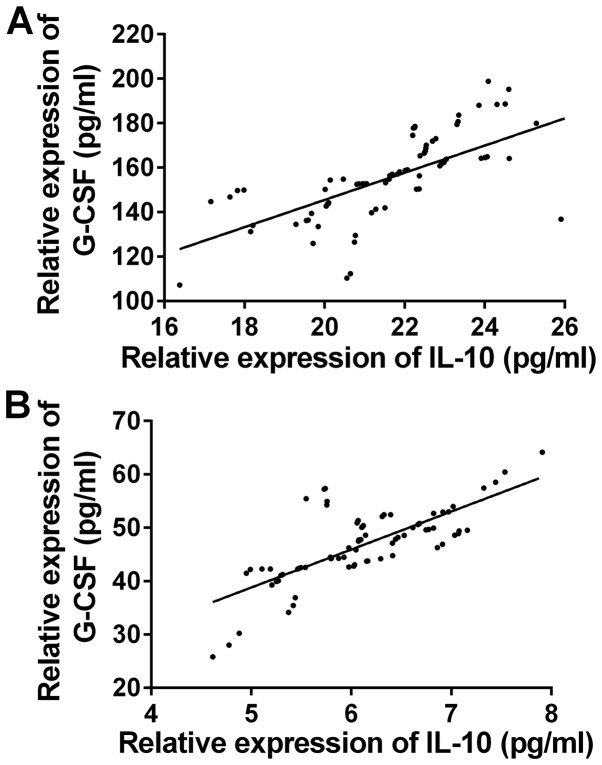
Figure 1.
Correlation of the expression levels of IL-10 and G-CSF in serum in observation group. Pearson's correlation analysis showed that there was a significant positive correlation between the expression levels of IL-10 and G-CSF (A) before and (B) after treatment in the observation group (r=0.6713, 0.7387, P<0.05).

