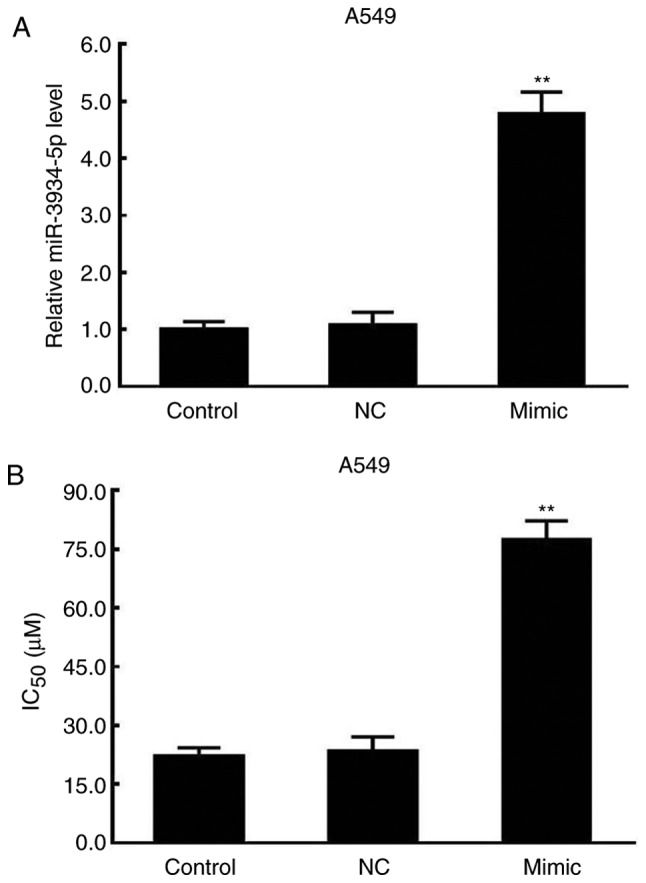
Figure 3.

Increased miR-3934-5p and IC50 by miR-3934-5p mimic in A549 cells. A549 cells were transfected with miR-3934-5p mimic and negative control. The IC50 was determined using an MTT assay and the expression of miR-3934-5p was assessed by reverse transcription-quantitative polymerase chain reaction analysis. (A) Expression of miR-3934-5p in A549 cells. (B) IC50 of A549 cells. **P<0.01 vs. NC. miR, microRNA; Control, untreated cells; Mimic, cells transfected with miR-3934-5p mimic; NC, cells treated with miR-negative control mimics; IC50, half-maximal inhibitory concentration.
