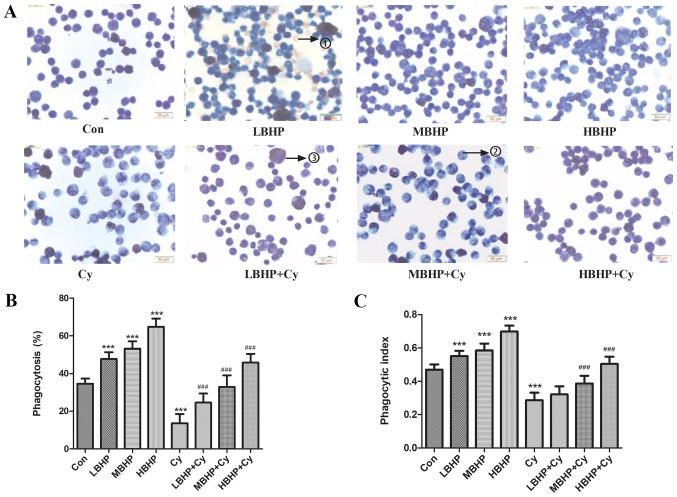
Figure 3.
Macrophage phagocytosis in normal untreated mice and normal and immunosuppressed mice treated with BHP. (A) Wright's staining results (×400 magnification with a light microscope). Due to the pre-injection of starch, as a non-self-contained substance, such stimulation can produce more macrophages. Numerous macrophages, macrophages that have engulfed chicken red blood cells, and a small number of unphagocytosed chicken red blood cells were observed under oil microscope. The numbers on the images represent the following: 1) unphagocytosed chicken red blood cells; 2) macrophages that have not engulfed chicken red blood cells, and 3) macrophages that had engulfed chicken red blood cells. (B) Percentage of phagocytosis. Phagocytosis was increased significantly in the LBHP, MBHP and HBHP groups and decreased significantly in the Cy group compared with that in the Con group. Phagocytosis was increased significantly in the LBHP + Cy, MBHP + Cy and HBHP + Cy groups compared with that in the Cy group. (C) Phagocytic index. The index was increased significantly in the LBHP, MBHP and HBHP groups and decreased significantly in the Cy group compared with that in the Con group. The index was increased significantly in the MBHP + Cy and HBHP + Cy groups compared with that in the Cy group. ***P<0.0001 vs. Con group; ###P<0.0001 vs. Cy group. All data were from two independent experiments, each of which was repeated in parallel twice. BHP, bioactive hepatic peptide; LBHP, low-dose BHP; MBHP, mid-dose BHP; HBHP, high-dose BHP; Cy, cyclophosphamide.

