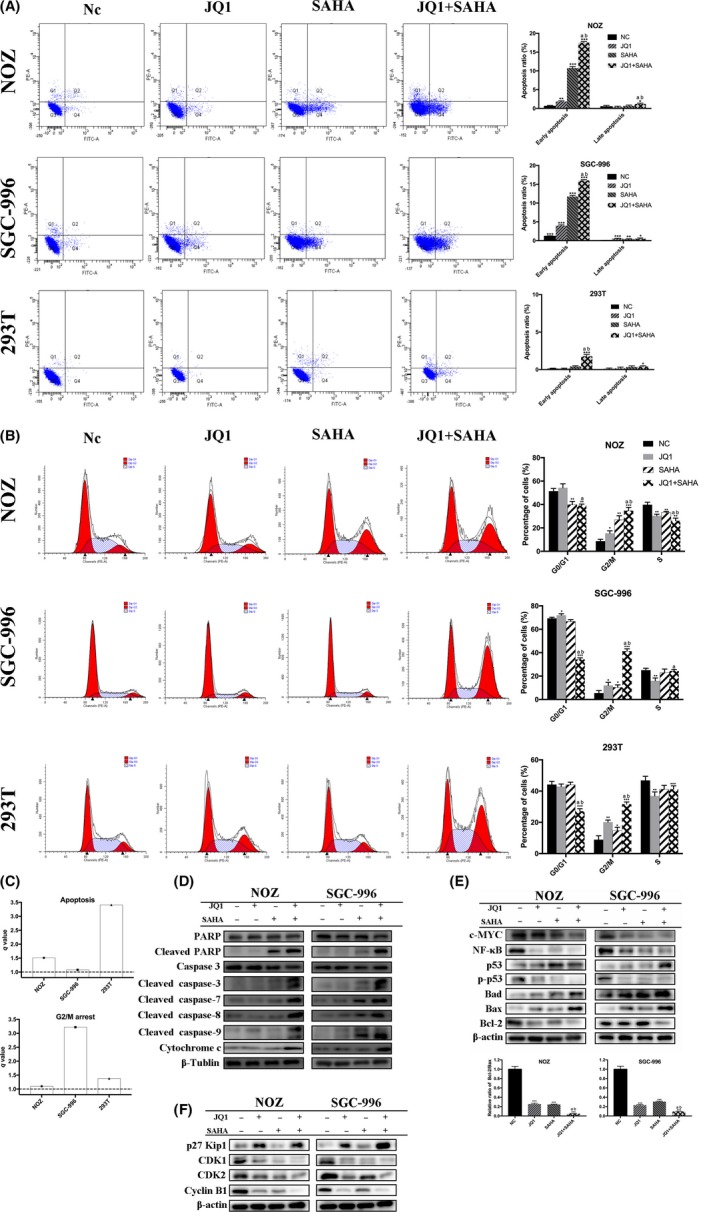
Figure 4.

JQ1 and suberoylanilide hydroxamic acid (SAHA) synergistically induced apoptosis and G2/M arrest. A, Apoptosis assay was performed by flow cytometry. NOZ and SGC‐996 cells were treated with JQ1 and/or SAHA for 48 h. The Q3 quadrant, Q4 quadrant, Q2 quadrant and Q1 quadrant indicate the percentages of normal cells, early apoptotic cells, late apoptotic cells and dead cells, respectively. Bar charts showed the ratio of apoptotic cells. B, The cell cycle distribution was analyzed by flow cytometry. Bar charts show the percentages of cell cycle distribution. C, q values are all >1.0, indicating that JQ1 and SAHA showed synergistic effects in inducing apoptosis and G2/M arrest. D and E, Apoptosis‐related proteins and other important proteins were analyzed by western blot. Bar charts showed the relative ratio of Bcl‐2/Bax. F, Cell cycle‐related proteins were analyzed by western blot. All data are presented as mean ± SD and all the experiments were repeated 3 times. q value is shown as a column chart and: <1.0 indicates antagonism, =1.0 additivity, >1.0 synergy. Significant differences are indicated by *P < 0.05, **P < 0.01 and ***P < 0.001 vs negative control (NC); a: P < 0.05 JQ1 vs JQ1 + SAHA; b: P < 0.05, SAHA vs JQ1 +SAHA
