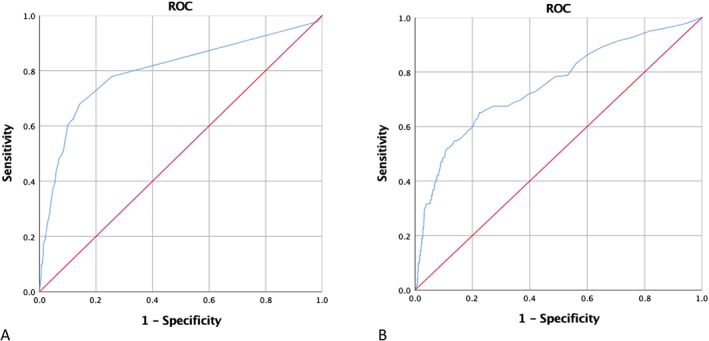
Figure 1.

Receiver operator curve (ROC) analysis. (A) Correlation between in‐hospital mortality and increase in bilirubin at 3.5 days post‐operatively (sensitivity: 67.9%, specificity: 85.8%, area under the curve: 0.8). (B) Cut‐off value for bilirubin increase at 5.35 mg/dL and occurrence of in‐hospital mortality (sensitivity: 65.2%, specificity: 77.5%, area under the curve: 0.752).
