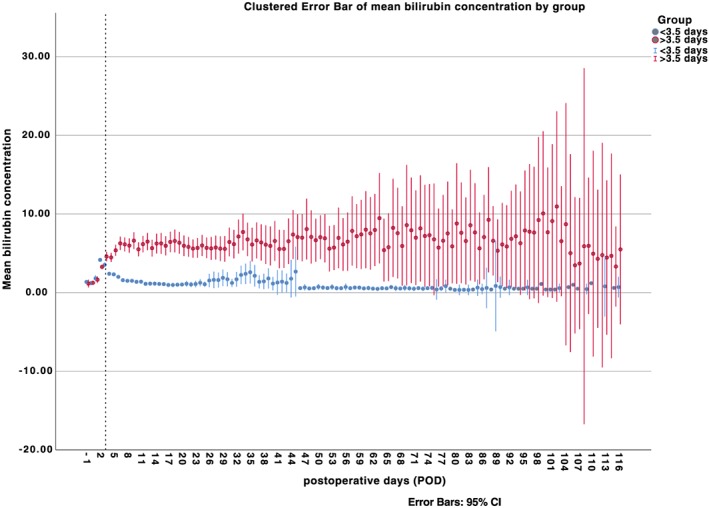
Figure 3.

Overall bilirubin values. Depiction of overall bilirubin values divided into subgroups according to reached maximum bilirubin level less than and greater than 3.5 post‐operative day. The dashed line marks the end of post‐operative day 3. CI, confidence interval.
