Figure 3.

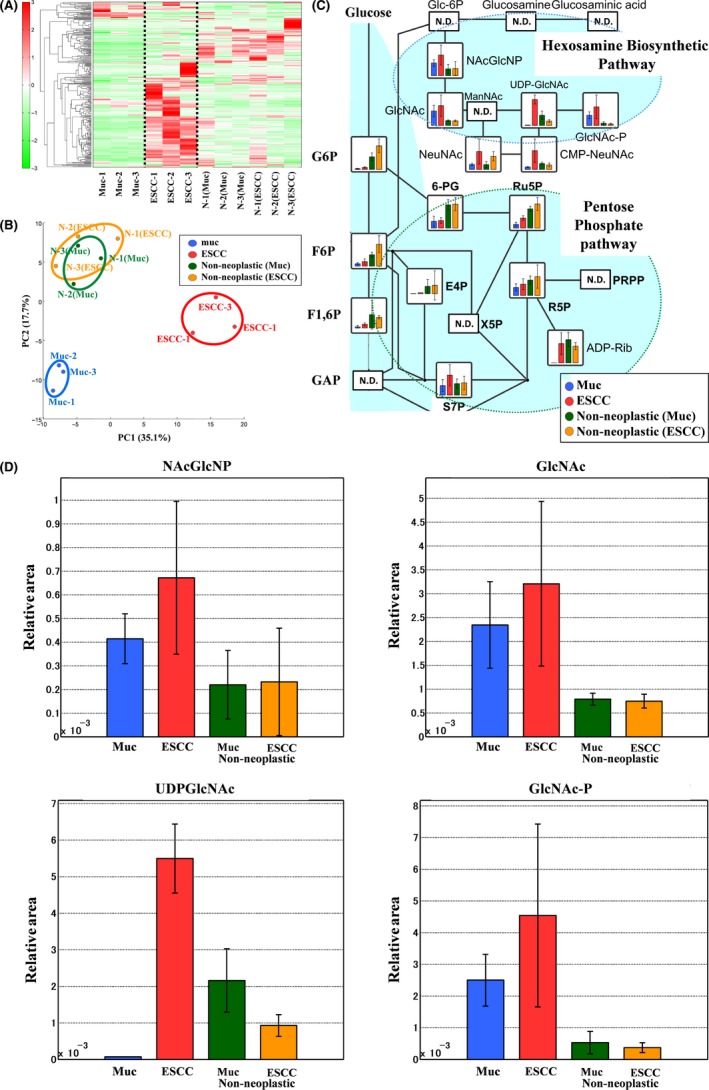
Metabolomics analysis of rat esophageal tissues. A, Clustering analysis. The hierarchical clustering analysis identified 3 clusters corresponding to mucinous adenocarcinomas (Muc‐1 to Muc‐3), esophageal squamous cell carcinomas (ESCC) (ESCC‐1 to ESCC‐3), and nonneoplastic samples [N‐1(Muc) to N‐3(Muc) and N‐1(ESCC) to N‐3(ESCC)]. B, PCA. Blue circle: Mucinous adenocarcinomas (n = 3), red circle: ESCCs (n = 3), green circle: nonneoplastic tissues from mucinous adenocarcinomas (n = 3), orange circle: nonneoplastic tissues from ESCCs (n = 3). Metabolites were organized into 3 groups in both PCA and clustering analysis: adenocarcinoma, squamous cell carcinoma, and nonneoplastic tissue. C, HBP activation in esophageal cancer tissue, (ND: Not detected). PPP upregulation is not apparent, while HBP activation is evident. UDP‐GlcNAc production notably increased in ESCCs. D, Representative metabolites in rat esophageal tissues. Error bars indicate SD (n = 3). Representative metabolites in cancer tissues in the HBP, such as NAcGlcNP, GlcNAc, and GlcNAc‐P, increased considerably compared with in nonneoplastic tissues. UDP‐GlcNAc production significantly increased in ESCCs (Welch's t test, P = .009)
