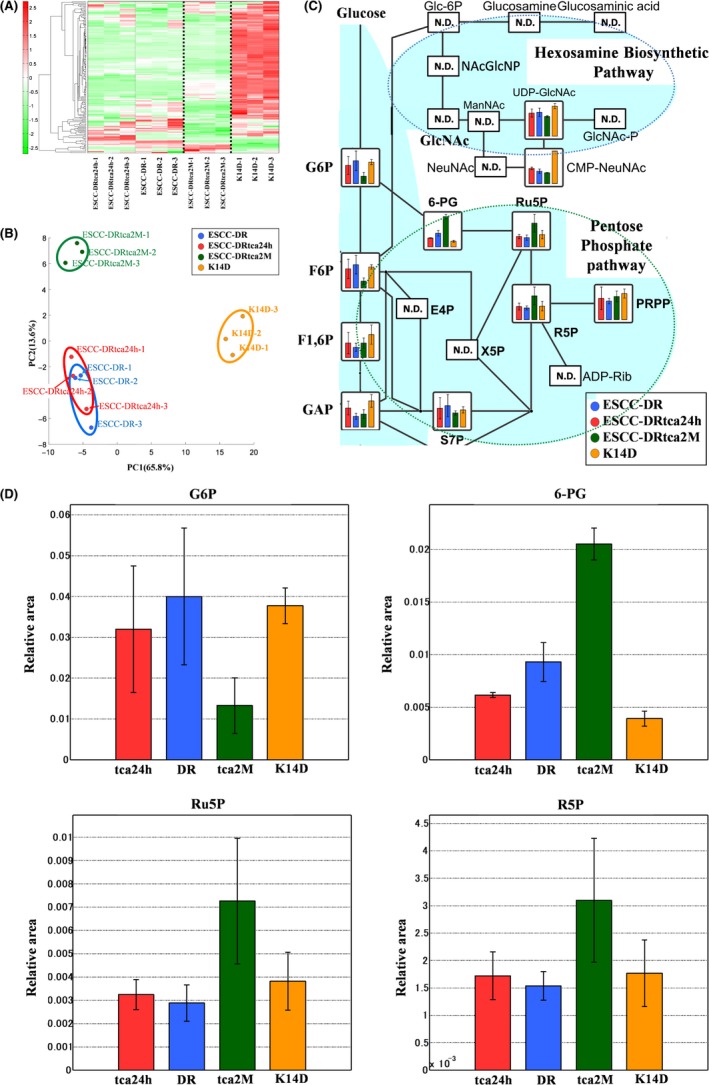
Figure 6.

Metabolomics analysis of ESCC lines. A, Clustering analysis.The hierarchical clustering analysis identified 3 clusters, which were divided by a bold dotted line, corresponding to the K14D, ESCC‐DRtca2M, and ESCC‐DR and ESCC‐DRtca24h lines. The clusters of ESCCDRtca24h and ESCC‐DR were similar. B, PCA. Blue circle: ESCC‐DR (n = 3), red circle: ESCC‐DRtca24h (n = 3), green circle: ESCC‐DRtca2M (n = 3), orange circle: K14D (n = 3). Metabolites were organized into 3 groups in the PCA: K14D, ESCC‐DRtca2M, and ESCC‐DR and ESCC‐DRtca24h lines. A shift of ESCC‐DRtca24h cluster from ESCC‐DR cluster in the direction of ESCC‐DRtca2M cluster occurred. C, Bile acid exposure upregulates the pentose phosphate pathway (ND: Not detected). Compared with other lines, ESCC‐DRtrca2M cells had considerably lower levels of glycolysis products (G6P, F6P, F1,6P), and much higher levels of PPP‐related metabolites (6‐PG, Ru5P, R5P). Conversely, most metabolites in the HBP were not detected. D, Representative metabolites in ESCC lines. Error bars indicate SD (n = 3). Although the volume of G6P associated with glycolysis was the lowest in ESCC‐DRtca2M cells, Ru5P, and R5P in ESCC‐DRtca2M cells were much higher than in ESCC‐DR, ESCC‐DRtca24h, and K14D cells. 6‐PG in ESCC‐DRtca2M cells was considerably higher than in the other cell lines
