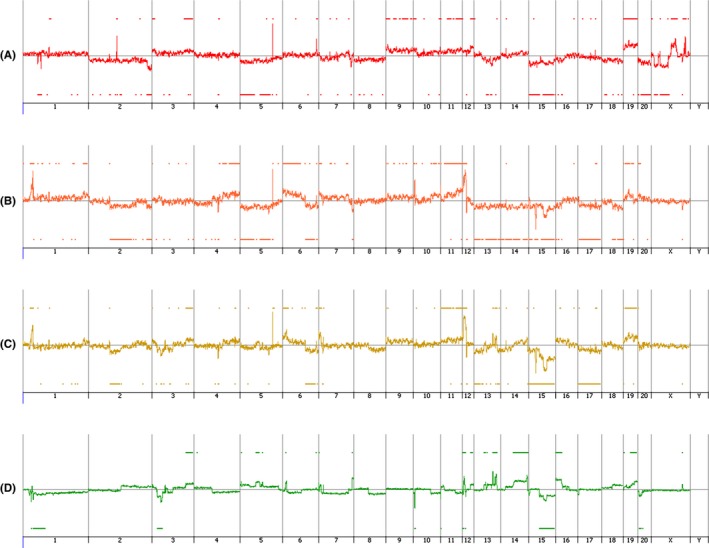
Figure 8.

Comparative genomic hybridization microarray analysis of esophageal cell lines. A, K14D, B, ESCC‐DR, C, ESCC‐DRtca2M, D, ESCC‐DR vs ESCC‐DRtca2M. Upward and downward changes indicate copy number gain and deletion, respectively. Numerous chromosome abnormalities were detected in all the 3 cell lines (K14D, ESCC‐DR, ESCC‐DRtca2M) (A‐C). Subsequently, as a test, ESCC‐DRtca cells were analyzed concerning ESCC‐DR (control). D, Indicates that the tumor progression caused by continuous TCA stimulation is associated with numerous additional chromosome abnormalities
