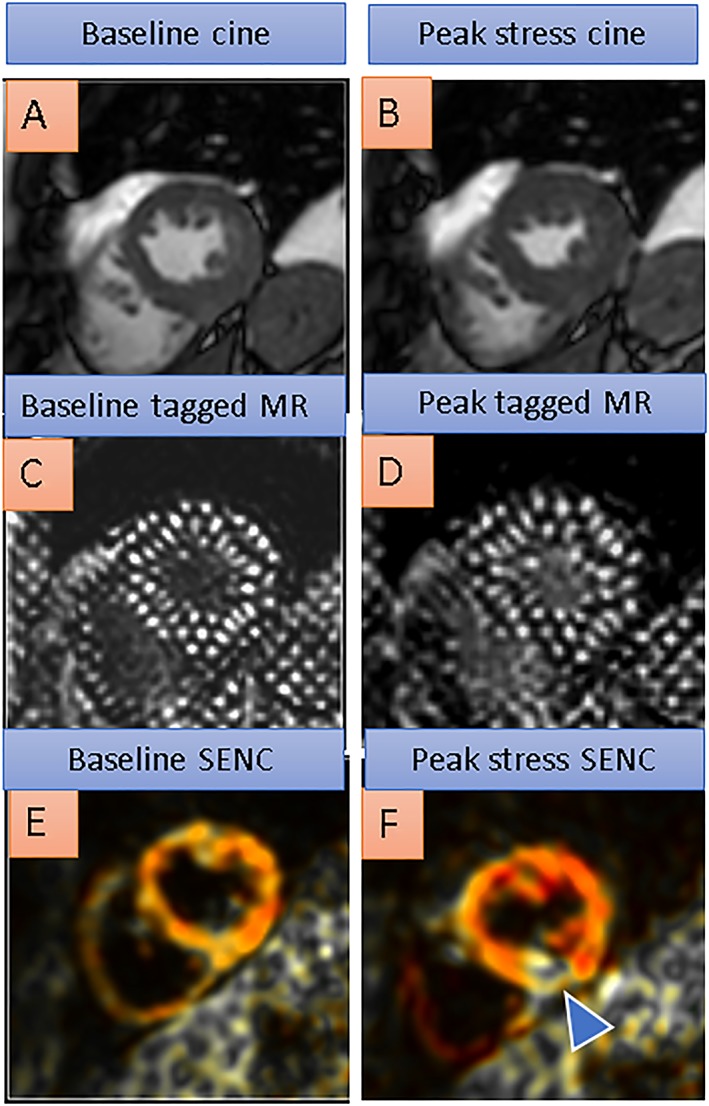
Figure 3.

Baseline cine, tagged magnetic resonance (MR), and SENC images on the left compared with peak dobutamine stress images on the right side. Inducible ischaemia of the inferior wall during high‐dose dobutamine stress is missed by conventional cine (A and B) and by tagged MR (C and D) but can be detected by conventional SENC images (E and F, blue arrowhead in F depicting reduced strain response during dobutamine stress in the inferior left ventricular wall, coded yellowish/white compared with normal strain in the corresponding anterior wall, coded red) in a patient with a right coronary artery stenosis.
