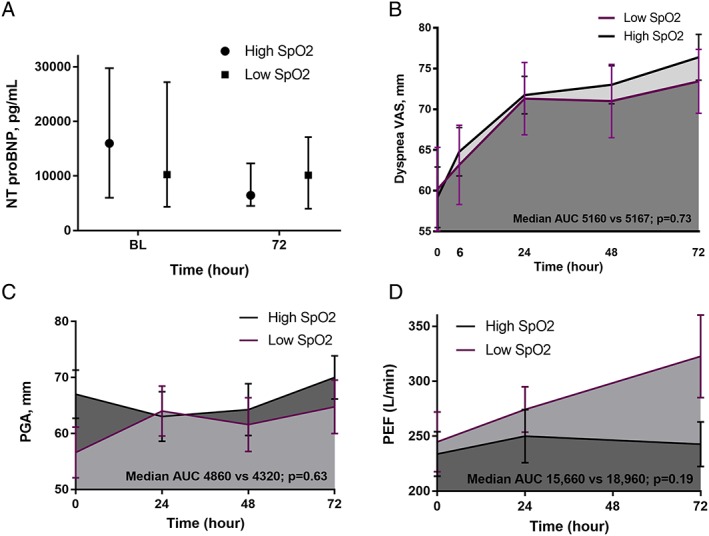
Figure 3.

Change in NT‐proBNP levels (A), dyspnoea VAS (B), patient global assessment (C), and peak expiratory flow (D) from baseline to 72 h in groups with high and low SpO2 targets. Note: AUC, area under the curve; BL, baseline; NT‐proBNP, N‐terminal pro‐brain‐type natriuretic peptide; PEF, peak expiratory flow; PGA, patient global assessment; SpO2, peripheral oxygen saturation level; VAS, visual analogue scale.
