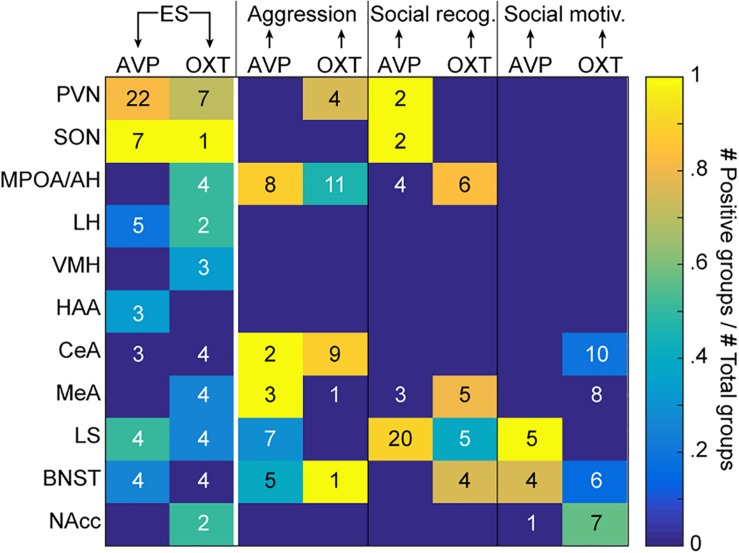
FIGURE 1.
Evidence for causal relationships. The color code indicates, for each region of interest listed on the y-axis, the proportion of experimental groups showing a causal effect of ES on AVP or OXT (first two columns), and of AVP or OXT on the three social behaviors of interest (aggression, social recognition, and social motivation; last six columns). The number in each cell indicates the total number of tested groups. The arrows at the top of the graph indicate the directionality of the causality. Different groups can be reported together in the same manuscript (see Supplementary Tables S1, S2 for details and references). ES, early life stress; social rec, social recognition; social motiv, social motivation; PVN, hypothalamic paraventricular nucleus; SON, hypothalamic supraoptic nucleus; MPOA/AH, medial preoptic nucleus/anterior hypothalamus; LH, lateral hypothalamus; VMH, ventromedial hypothalamus; HAA, hypothalamic attack area; CeA, central amygdala; LS, lateral septum; BNST, bed nucleus of the stria terminalis.

