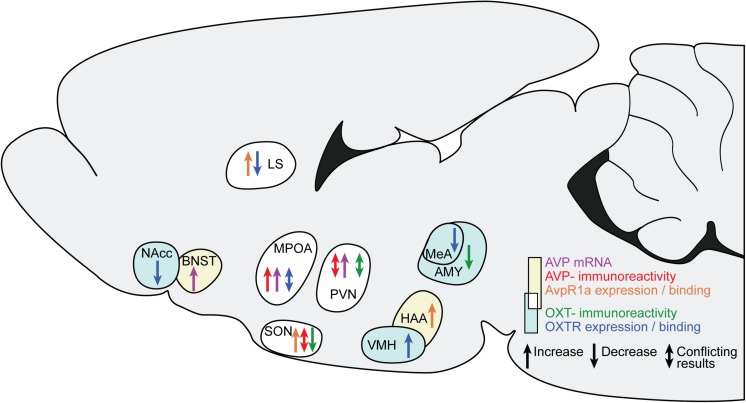
FIGURE 2.
Changes in AVP and OXT in brain regions after ES. The sagittal slide schematically illustrates the brain regions showing AVP and OXT changes after ES. Yellow background and warm colors in the arrows indicates regions and effects associated with AVP, light cyan and cold colors indicates regions associated with OXT. The white background indicates regions associated with both AVP and OXT. LS, lateral septum; BNST, bed nucleus of the stria terminals; MPOA, medial preoptic nucleus; SON, hypothalamic supraoptic nucleus; PVN, hypothalamic paraventricular nucleus; VMH, ventromedial hypothalamus; HAA, hypothalamic attack area; MeA, medial amygdala.

