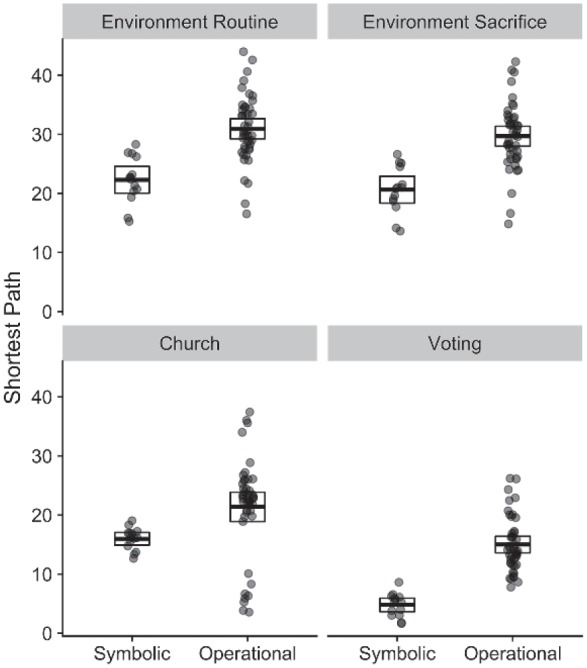
Figure 3.

Symbolic components (n = 14) are more closely connected (have shorter paths) with behaviors than operational components (n = 45).
Lower values imply higher centrality. Points represent individual nodes from both panels of Figure 2. Points are horizontally jittered to improve clarity. Top and bottom edges of the boxes represent upper and lower bounds of the 95% confidence interval of the mean. The centerline of the box represents the mean.
