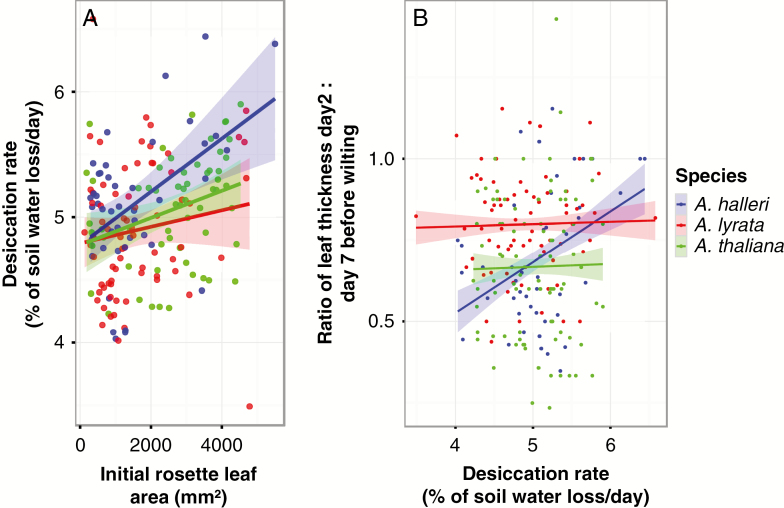
Fig. 4.
Correlations between desiccation rate and initial leaf size and desiccation rate and the relative leaf water loss. (A) Correlation between the initial rosette leaf area (at 60 % of soil moisture) and the percentage of soil desiccation rate [Pearson correlation coefficients and P-values for: Arabidopsis thaliana (r = 0.32, P = 0.013); A. lyrata (r = 0.14, P = 0.22) and A. halleri (r = 0.48, P = 0.00072)]. (B) Correlation between the relative water loss in leaves before wilting (equivalent to the ratio of leaf thickness on day 2 vs. day 7 before wilting) and the desiccation rate [Pearson correlation coefficients and P-values for: A. thaliana (r = 0.018, P = 0.732); A. lyrata (r = 0.023, P = 0.692) and A. halleri (r = 0.39, P = 4.282.10-08)]. Results are shown for the second biological experiment. Lines represent a linear regression smoothing where the shaded ribbons represent the standard error.

