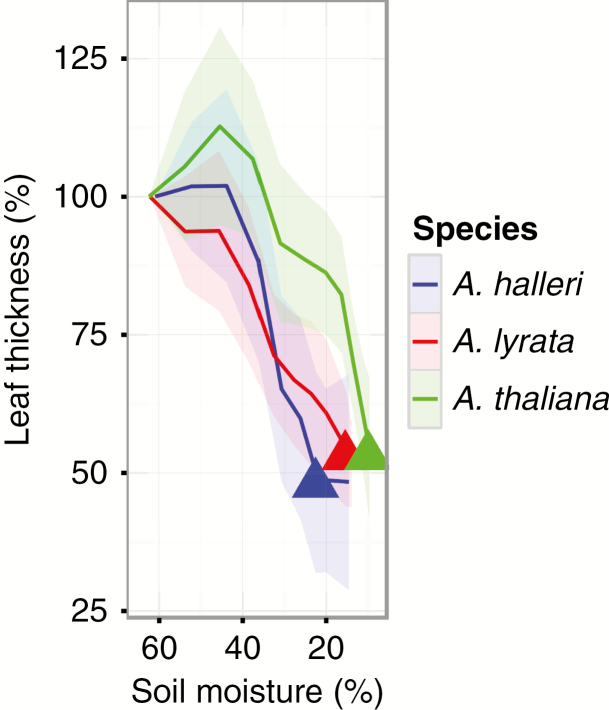
Fig. 5.
Leaf thickness in response to decrease of soil moisture for Arabidopsis thaliana, A. halleri and A. lyrata. Results were collected in the second biological experiment. Shaded ribbons represent the standard deviation. Filled triangles correspond to the average wilting soil moisture for the different species.

