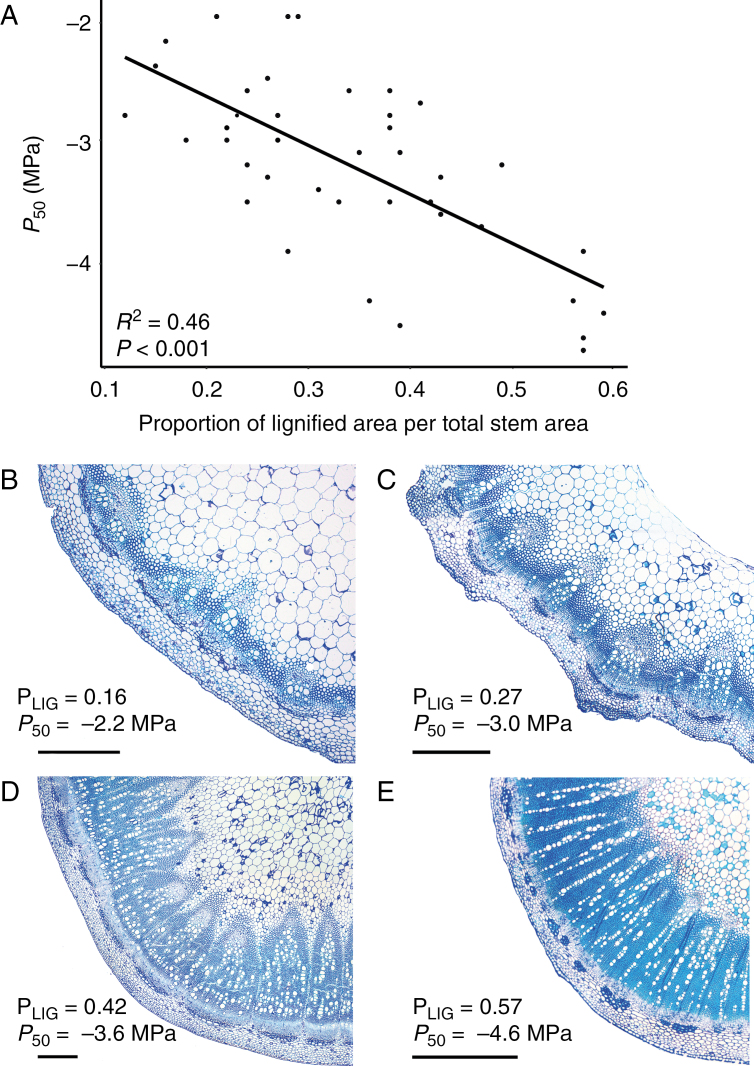
Fig. 4.
Relationships between stem P50 and the proportion of lignified area per total stem area (PLIG). (A) Linear regression between P50 and PLIG. The adjusted R2 and the level of significance are given. Each dot represents one individual (on average three individuals per species). (B–E) Light microscope images of cross-sections through the stem of Brassicaceae species showing an increase of PLIG matching with an increase in embolism resistance. (B) Raphanus raphanistrum. (C) Sinapis alba. (D) Rapistrum rugosum. (E) Sisymbrium orientale from the drier sampling site. The scale bars represent 500 μm.

