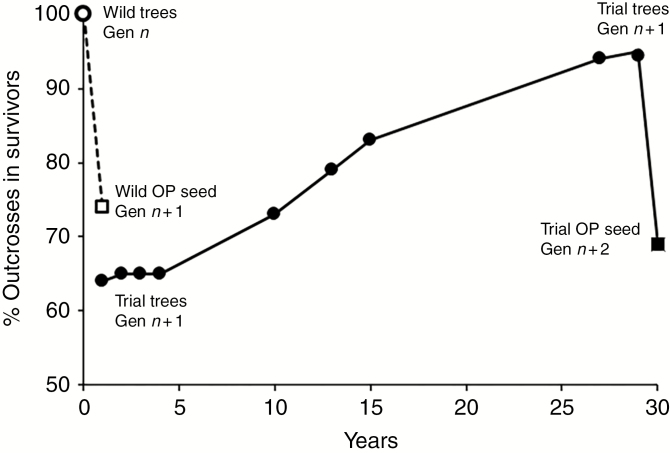
Fig. 5.
Multigenerational variation in estimated percentage of outcrossed genotypes alive at different stages of the life cycle of E. regnans. The figure shows the estimate for the wild parental trees, generation n (see text); open-pollinated (OP) seed from those trees representing the start of generation n + 1 (Narracan stand only; see Moran et al., 1989); the change over time in the proportion of surviving outcrosses in an experimental n + 1 population comprising a known mix of self and outcross progeny (Experiment 2); and the estimate derived from microsatellite assay of seed from that population, forming the basis of the n + 2 population. The complete outcrossed status of the population of wild parental trees at generation n is derived from estimated inbreeding coefficients from allozyme studies presented in Moran et al. (1989) (Narracan) and the present study (Thorpdale). The estimates over time for generation n + 1 are derived from Hardner and Potts (1997, fig. 3) and extended to 29 years in the present study. The seed estimates for generation n + 2 are derived from the OP seed assayed in the present study that were harvested from reproductive Gen n + 1 trees at age 29 years (see Supplementary Data Table S2).

