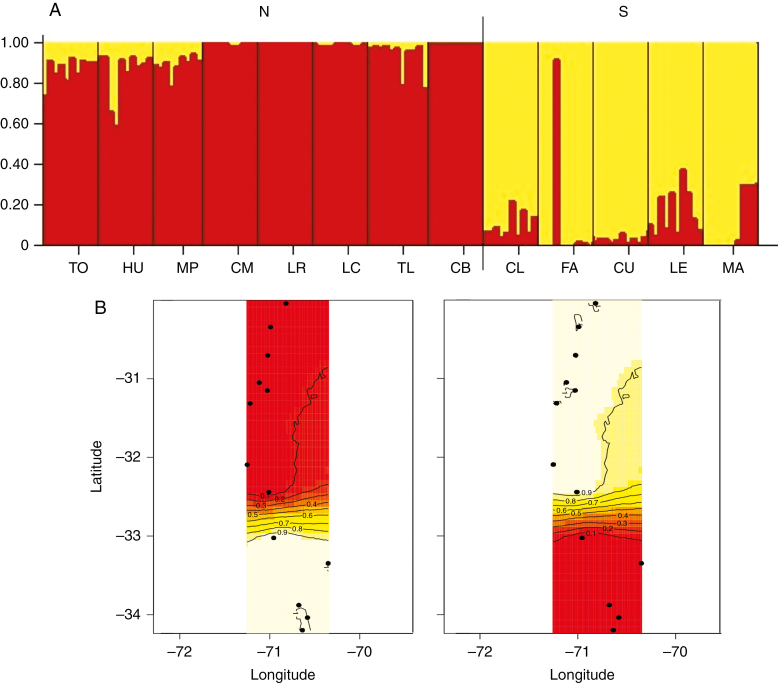
Fig. 5.
Population structure of Echinopsis chiloensis inferred with Structure (A) and Geneland (B). (A) Bayesian clustering of sampled individuals. Each individual is represented by a vertical column partitioned into K = 2 coloured groups (North, red; South, yellow) according to its estimated membership coefficient. Sampling sites are separated by black lines (see abbreviations in Table 1). (B) Posterior probabilities of population membership and genetic discontinuities from the Geneland spatial model. Contour lines indicate the spatial position of genetic discontinuities and lighter colours indicate higher probabilities of population membership. Two genetic clusters were identified (left: North, right: South).

