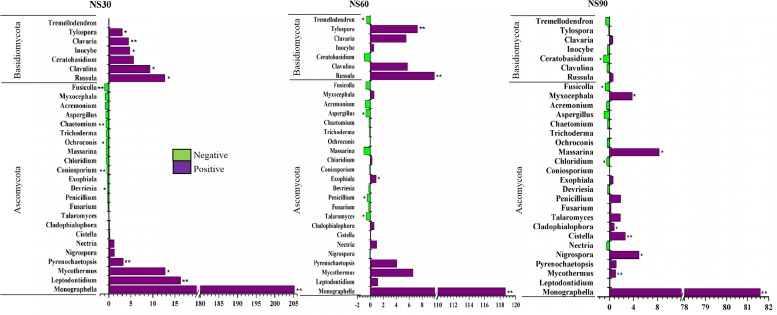
FIGURE 5.
Comparison of fungi abundance differences between rhizosphere and no-plant soil at the genus level. The values represent the means ± SE. An asterisk (∗) indicates that the differences in fungi abundance between sanqi and its corresponding control treatment at the same time were significant at p < 0.05. An asterisk (∗∗) indicates that the differences were significant at p < 0.01. NS30, NS60, and NS90 indicate rhizosphere soil from sanqi grown for 30, 60, and 90 days, respectively.

