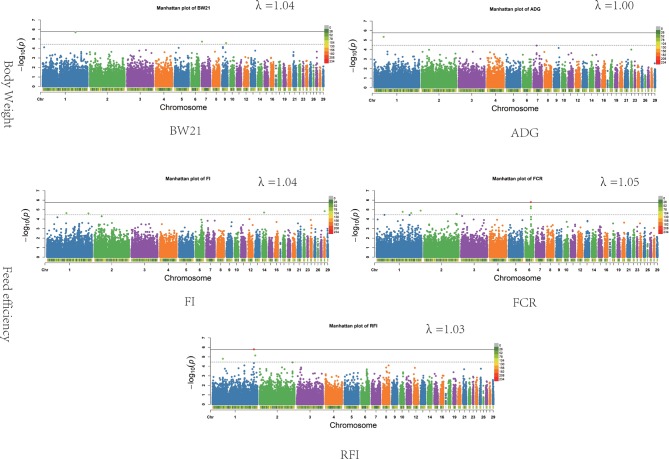
Figure 1.
Associations of SNPs for all traits. In Manhattan plots, SNPs are plotted on the x-axis according to their position on each chromosome, against association with these traits on the y-axis (shown as −log10P-value). Dashed line indicates suggestive significance association level (P = 3.48E−05), and solid line shows genome-wide significance with a P-value threshold of 1.74E−06. The colour of points with suggestive significance are green while points of genome-wide significance are red. The heatmap represents density of SNPs in 1 Mb windows. The estimated genomic inflation factor λ ranged from 1.03 to 1.05.

