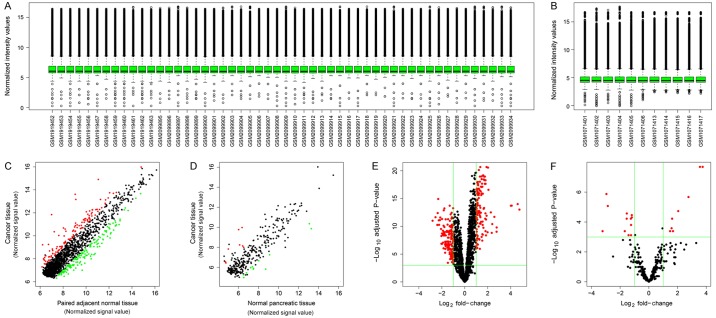
Figure 1.
Overview of the microarray datasets. (A) Box plots of the distributions of normalized signal intensities of the circRNA datasets. (B) Box plots for the distributions of normalized signal intensities of the miRNA datasets. (C) Scatter plots of the circRNA microarray signal values of between PDAC and adjacent normal tissues. Red dots represent upregulated circRNAs compared with normal tissues; green dots represent downregulated circRNAs compared with normal tissues; black dots represent equally expressed circRNAs. (D) Scatter plots of the miRNA microarray signal values between PDAC and normal tissues. Red dots represent upregulated miRNAs compared with normal tissues; green dots represent downregulated miRNAs compared with normal tissues; black dots represent equally expressed miRNAs. (E) Volcano plot of circRNA datasets. Red dots represent differentially expressed circRNAs. (F) Volcano plot of miRNA datasets. Red dots represent differentially expressed miRNAs. circRNA, circular RNA; miRNA, microRNA; PDAC, pancreatic ductal adenocarcinoma.

