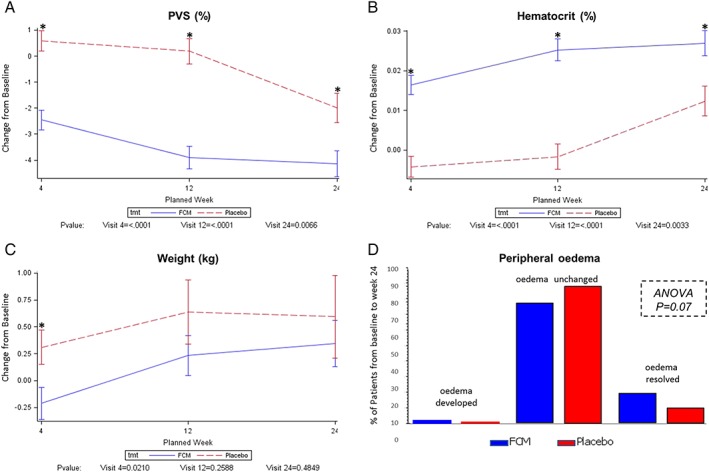
Figure 2.

Change in markers of congestion in FAIR‐HF. Alterations from baseline to week 24 in PVS (A), Hct (B), weight (C), and peripheral oedema (D) are shown. A total of 372, 371, and 309 patients had data for analysis at weeks 4, 12, and 24, respectively. ANOVA, analysis of variance; FCM, ferric carboxymaltose; PVS, plasma volume status.
