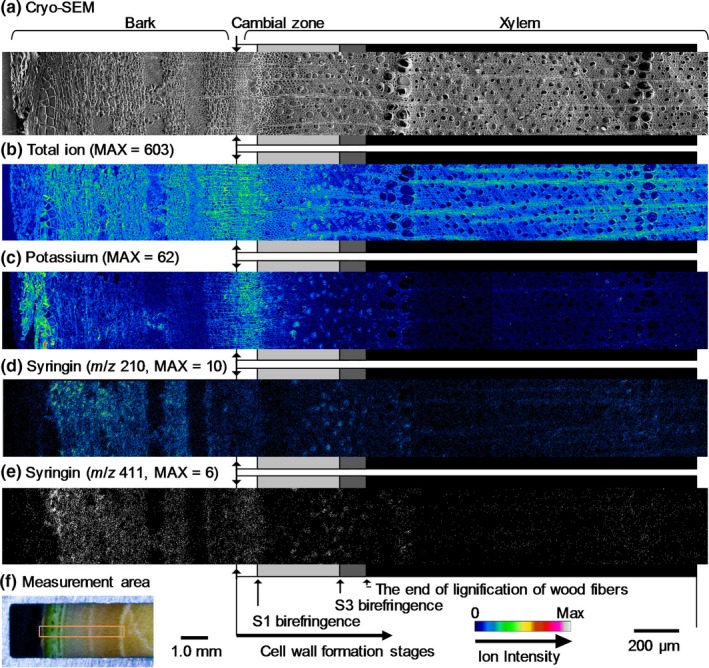
Figure 3.

Transverse surface images of a freeze‐fixed lilac stem by cryo‐TOF‐SIMS/SEM. (a) Cryo‐SEM image taken after cryo‐TOF‐SIMS measurements and an appropriate freeze‐etching step. Cryo‐TOF‐SIMS‐positive ion images of (b) total ions, (c) K+ at m/z 38.96, (d) syringin at m/z 210, and (e) syringin at m/z 411 (binary image). (f) Optical microscopy image of the transverse surface of a freeze‐fixed lilac stem in the cryo‐TOF‐SIMS/SEM sample holder showing the measurement area. Grayscale tetragons on both sides of the images of (a–d) suggest the cell wall formation stages of wood fibers. Scale bars are 100 μm for (a–e) and 1.0 mm for (f)
