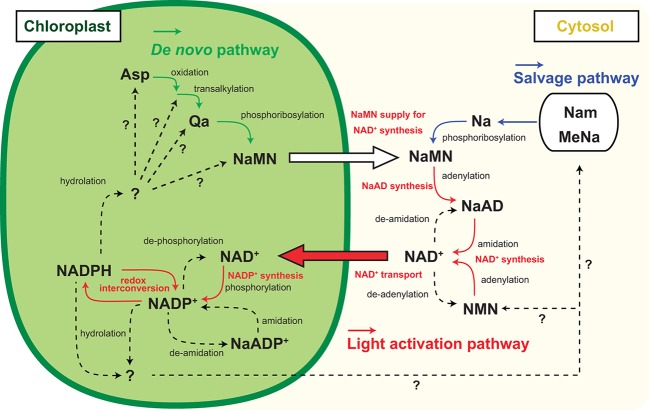
Figure 2.
Inter-organelle nicotinamide adenine dinucleotide (NAD) metabolism associated with chloroplastic NADP dynamics. Schematic representation of NADP+ biosynthesis and NAD+ biosynthesis and part of their metabolism and inter-organelle transport. Solid arrow indicates the identified molecular conversion, and dashed arrow indicates unidentified molecular conversion. Green line highlights the de novo pathway, and blue line highlights the salvage pathway of NAD+ biosynthesis. Red line highlights the light activation pathway. Abbreviations are as shown in the text except for Nam, MeNa, and NMN indicating nicotinamide, methyl nicotinate, and nicotinamide mononucleotide, respectively.

