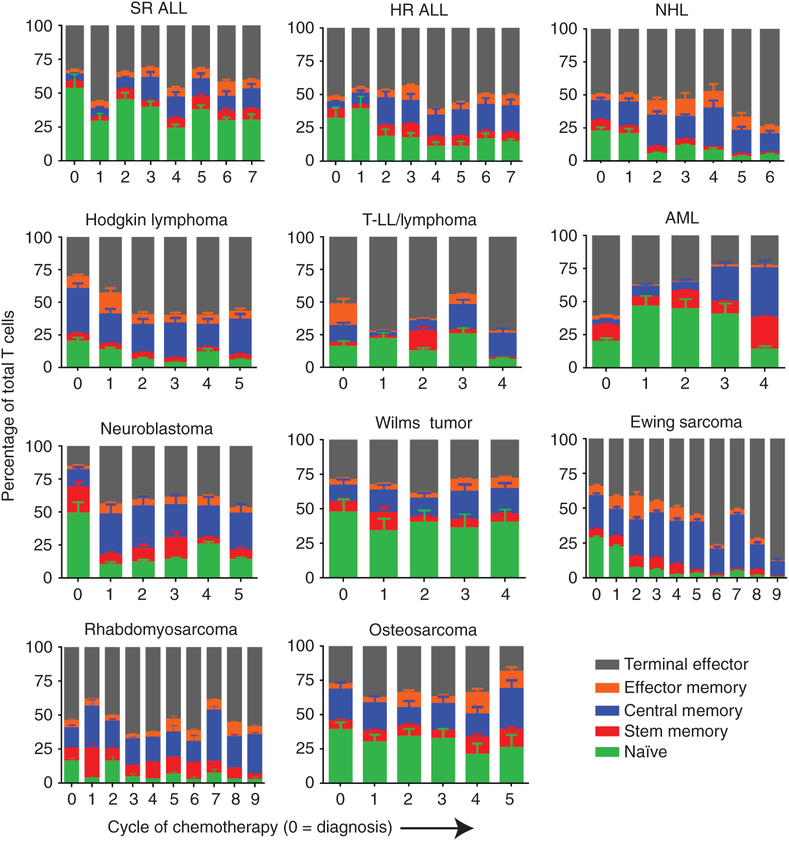
Figure 2.
T-cell phenotypes of cells harvested from the peripheral blood of patients undergoing chemotherapy. Each disease from Fig. 1 is represented with percentages of each of the five subsets of T cells described. The X axis represents each cycle of chemotherapy (0 is prechemotherapy). Error bars, SD of each subset. The pattern of naïve T-cell percentage largely tracks with expansion potential. SR ALL, AML, Wilms tumor, and osteosarcoma are notable for the stable percentage of naïve T cells compared with other diseases. The definitions of the T-cell phenotypes are described in the Methods. See Supplementary Table S2 for statistical summary of significant trends.

