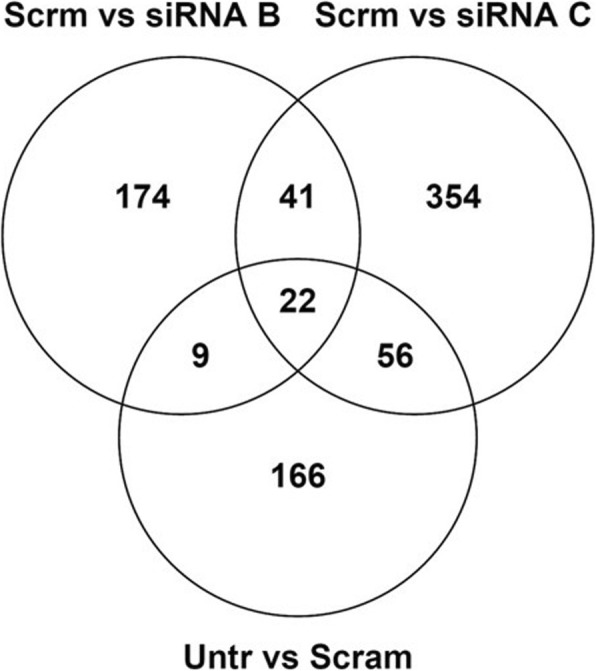
Fig. 5.

Venn diagram illustrating the number of genes differentially expressed following GSTCD knockdown for the indicated conditions. The GSTCD knock down gene expression profile was compared with the scrambled and shows 41 genes to be reproducibly changed in both siRNA B and C and not confounded by differences between control conditions untransfected/scrambled
