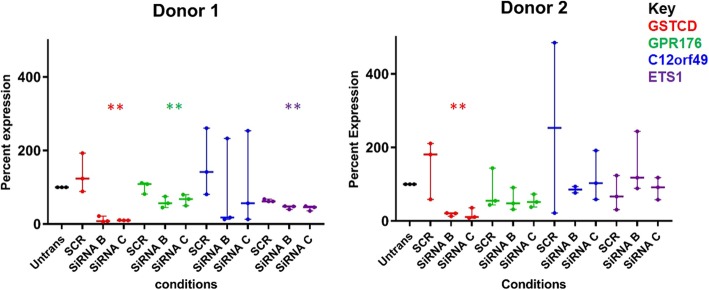
Fig. 6.
Quantitative PCR analysis of three genes which were differentially expressed after GSTCD knock down in RNA-seq analyses. The Taqman was performed in two different donors, the original donor which RNAseq was performed (donor 1) and a second donor for comparison (donor 2). Untransfected set at 100% expression, red is GSTCD, green is GPR176, blue is C12orf49 and purple is ETS1. The 3 genes were chosen due to a good level of expression before and after GSTCD knock down as well as being high on the RNAseq gene list so that the effect can be seen by taqman analysis. Graph shows median and interquartile range data analysed using Kruskal-Wallis test. In donor 1 there is significant knockdown for both SiRNA B and C in genes GSTCD, GPR176 and ETS1 (P < 0.01), in donor 2 only GSTCD reached statistical significance

