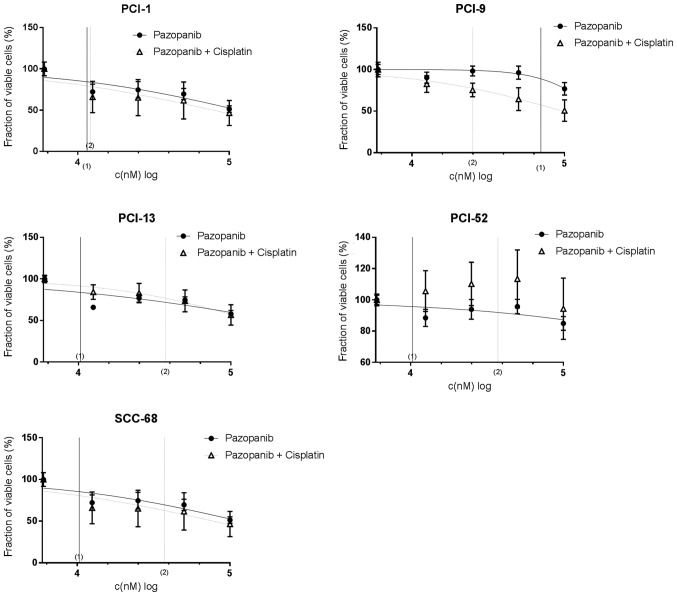
Figure 4.
Treatment efficacy of pazopanib and pazopanib + cisplatin in PCI-1, PCI-9, PCI-13, PCI-52 and SCC-68 cell lines. Treatment efficacy was determined using crystal violet staining. The tyrosine kinase inhibitor was administered at a log2-dilution, and a constant concentration of cisplatin (IC50 value) was added during combination treatment. IC50 values are indicated on the x-axis; (1) indicates mono-therapy, and (2) indicates combination therapy. A concentration-dependent effect was detected in all cell lines. IC50, half inhibitory concentration.

