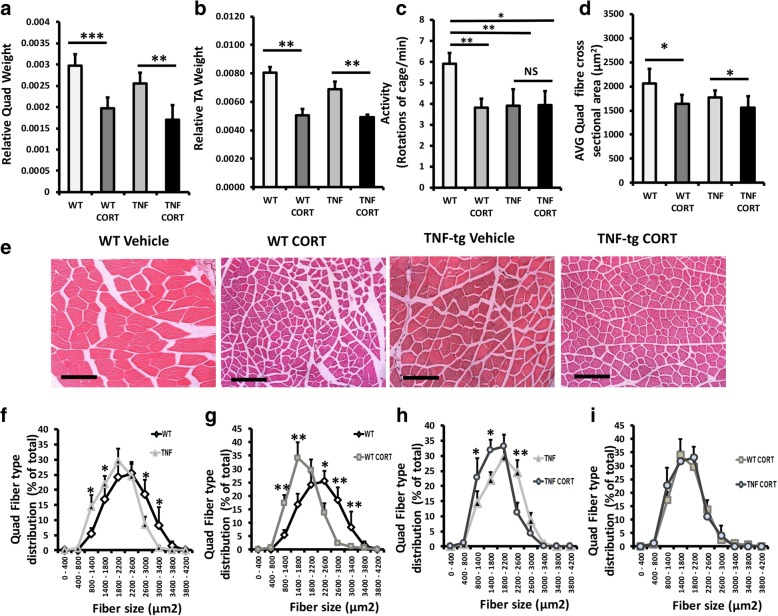
Fig. 4.
a, b Total quadriceps and tibialis anterior muscle weights relative to total bodyweight, c mouse activity determined by rotations of cage per minute, d average quadriceps muscle fibre cross sectional area (μm2), e representative images of quadriceps muscle sections, f–i distribution of quadriceps muscle fibre cross-sectional area determined using Image J in paraffin embedded sections in WT and TNF-Tg animals receiving either vehicle or corticosterone (100 μg/mL) in drinking water over 3 weeks. Values are expressed as mean ± standard error of six animals per group. Statistical significance was determined using two-way ANOVA with a Tukey post hoc analysis. *P < 0.05, **P < 0.005, ***P < 0.001 (scale bars, 50 μm)

