Fig. 1.
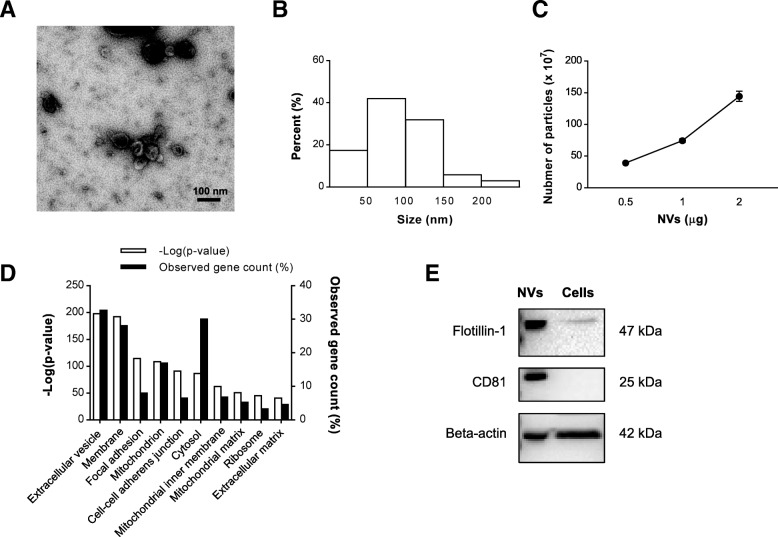
Characterization of MSC-derived NVs. a TEM image of purified NVs. Scale bar, 100 nm. b Size distribution of NVs according to diameter. c The number of particles per proteins of NVs measured by nanoparticle tracking analysis (n = 3). d Top 10 subcellular localization GO terms enriched in NV proteome (based on P value). Three biological replicates were used, and commonly identified proteins in three runs were analyzed for GO terms. e Western blot analysis of EV markers on NV (10 μg) and MSC lysates (25 μg)

