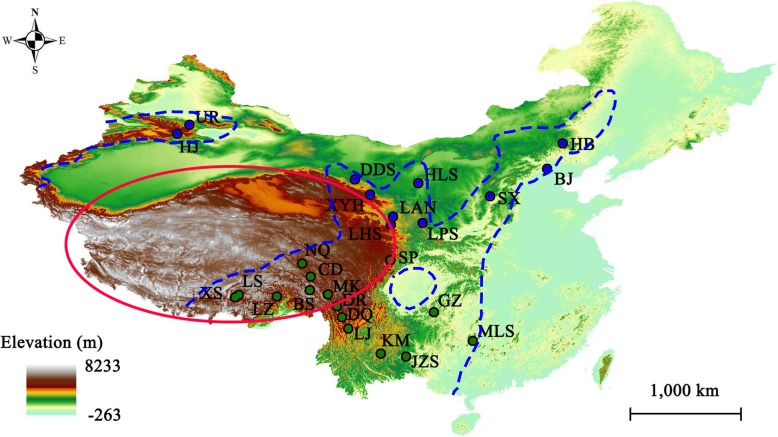
Fig. 1.
Sampling sites of Emberiza godlewskii in China (the map source is provided by Geospatial Data Cloud, Computer Network Information Center, Chinese Academy of Sciences (http://www.gscloud.cn)). The small circles represent our sampling sites, with blue indicating northern-lineage sites and green indicating southern-lineage sites. Capital letters denote the sampling localities s, which are presented in full in Additional file 1: Table S1. The area enclosed by blue dashed lines represents the distribution range of E. godlewskii, and the QTP is indicated with a red oval

