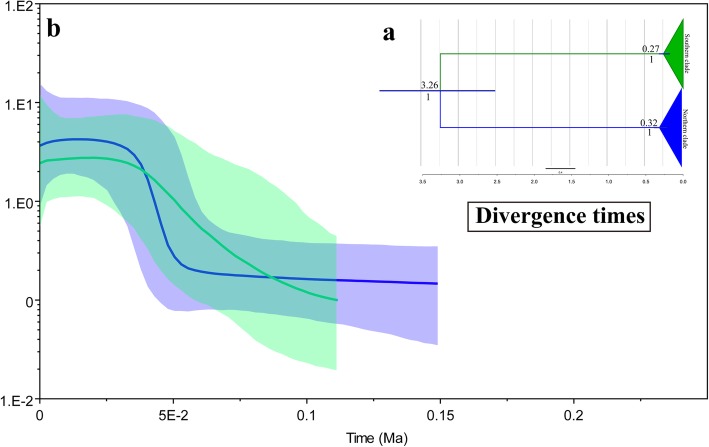
Fig. 4.
Calculated divergence times and historical demographic reconstruction based on mtDNA. a Estimation of the divergence time between lineages. The values below the node indicate Bayesian posterior probabilities, and values above the node represent divergence times. b BSP of the historical demographic trends of the two major lineages of Emberiza godlewskii. Blue denotes the northern lineage, and green denotes the southern lineage. The X axis is the timescale before present (Ma), and the Y axis is the estimated effective population size. Estimates of means are shown as solid lines, and the 95% HPDs are indicated by shaded areas

