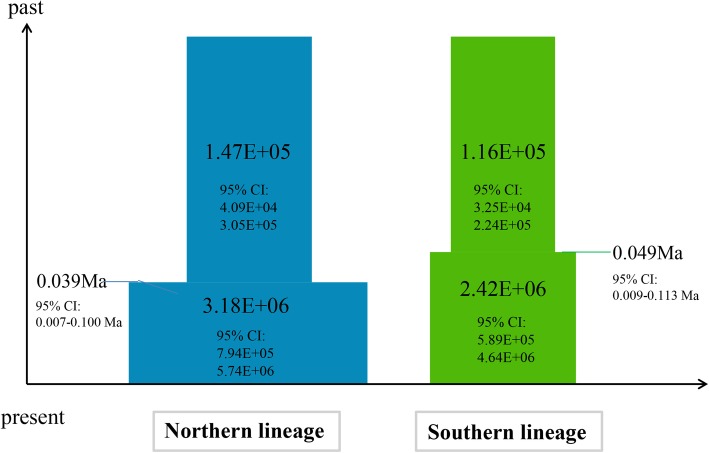
Fig. 5.
Summary of the inferred demographic history of the two genetic clades of E. godlewskii. Changes in population sizes are integrated into the divergence scenario. Mean population sizes with 95% CIs are indicated on each cylinder. Mean times of divergence with 95% CIs are indicated by fine horizontal lines

