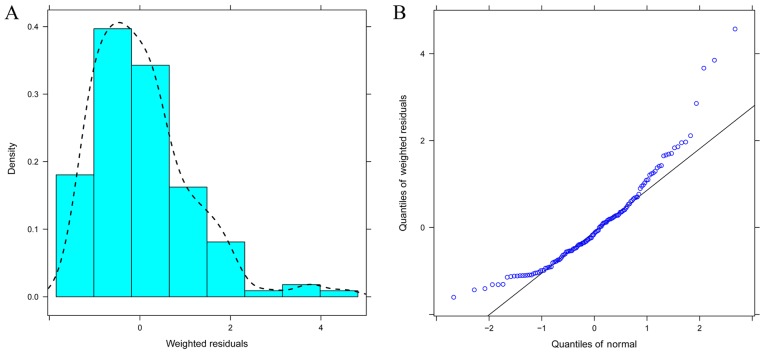
Figure 3.
Distribution of weighted residuals for the final model. (A) Density vs. weighted residuals. The black dashed line is the trend line of weighted residuals distribution for the final model. The closer the trend line is to the normal distribution, the more stable the model is. (B) Quantiles of weighted residuals vs. quantiles of normal. The x-axis value of a point is the quantiles of normal and the y-axis value of a point is the quantiles of weighted residuals. The black solid line is the line of unity (the y=x line). The closer the points are to the y=x line, the more stable the model is.

