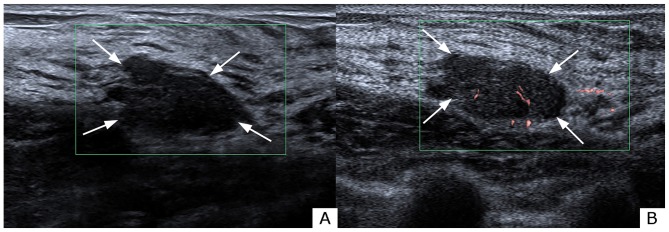
Figure 3.
Evaluation of blood build-up in a lesion of the right breast with (A) CDFI and (B) SMI in a 34-year-old female. Grading was grade 0 with CDFI and grade 1 with SMI. Analysis of the morphology revealed a linear pattern under SMI examination. The vessel distribution was central. The lesion was classified as ultrasonography BI-RADS category 4a under both CDFI and SMI. The lesion was pathologically determined as fibroadenoma. The white arrows indicate the lesion shown on CDFI and SMI. The red and blue areas represent vascularity. The difference between red and blue signals shown on CDFI denotes blood flow distribution. Red areas depict blood flow towards the probe, whereas the blue areas depict blood flow away from the probe. CDFI, color Doppler flow imaging; SMI, superb microvascular imaging; BI-RADS, Breast Imaging Reporting and Data System.

