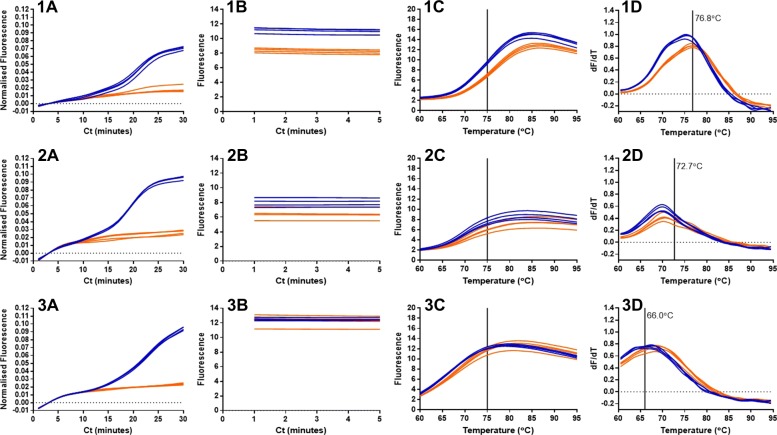
Fig. 10.
End point LAMP molecular beacons at 75 degrees C. LAMP amplification at 64 degrees C for 30 cycles of 60 seconds, followed by 95 degrees C for 5 min and 75 degrees C for 5 min with fluorescence acquisition. Melt curve analysis between 60 degrees C and 95 degrees C. Template in blue, NTCs in orange. (1) 35Sp LAMP amplification with 35Sp LOOP MB, (2) 35Sp LAMP amplification with 35Sp STEM MB and (3) NOSt amplification with NOSt STEM MB. (A) real-time normalised fluorescence during amplification, (B) end point fluorescence at 75 degrees C, (C) melt profiles showing separation at 75 degrees C and (D) melt curve analysis with the melt temperature (Tm) of the molecular beacon

