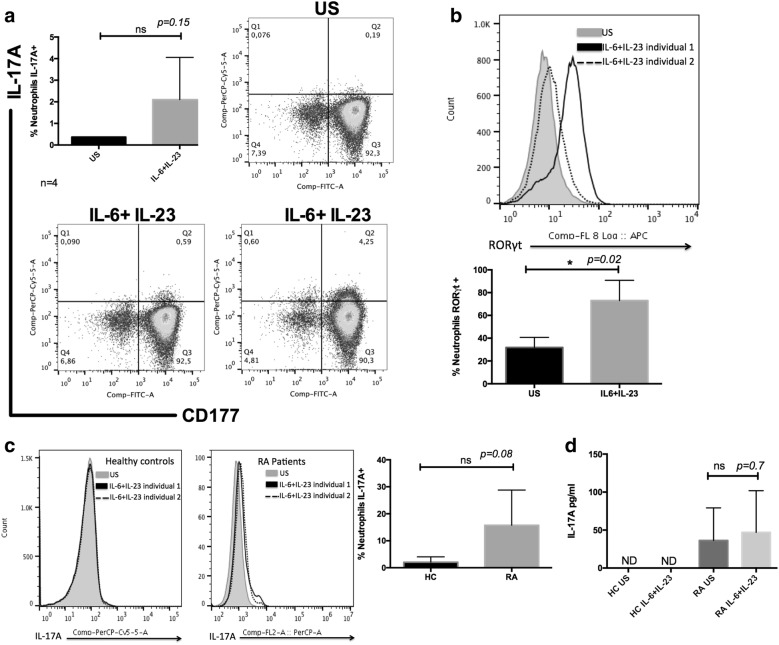
Fig. 4.
IL-6 and IL-23 are not enough to induce IL-17A production. a Neutrophils purified from healthy donors were stimulated with IL-6 and IL-23 for 3 h, and intracellular expression of IL-17A was assessed by flow cytometry. Representative dot plots show IL-17A-producing neutrophils. Unstimulated (US) neutrophils from a healthy donor, and IL-6 + IL-23 stimulates neutrophils from two different healthy donors. The bar graph shows the percentage of IL-17A-producing neutrophils (n = 4). b Neutrophils were stimulated as described in a, and the frequency of neutrophils expressing RORγ was analyzed by flow cytometry. Representative histograms from unstimulated neutrophils from a healthy donor (gray) and stimulated neutrophils from healthy donors (dashed line and dark lines). The bar graph shows the percentage of RORγ-positive neutrophils (n = 3). c Neutrophils isolated from RA patients and HCs were stimulated as in a and analyzed for the expression of IL-17A by flow cytometry. Representative histograms of neutrophils from healthy donors and RA patients. Unstimulated neutrophils (gray) and stimulated neutrophils (dashed line and dark lines). The bar graph shows the percentage of IL-17A-producing neutrophils (n = 4). d Neutrophils from RA patients and HCs were stimulated as in a for 16 h. Afterward, supernatants were collected and analyzed by CBA for IL-17A quantification (n = 4). The Mann–Whitney U-test was utilized and resulted in a p value < 0.0001

