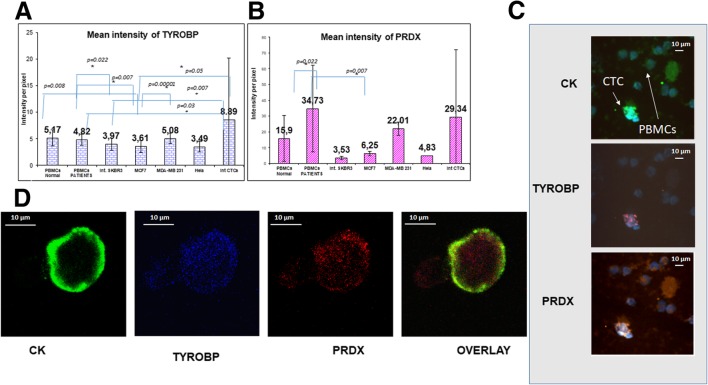
Fig. 3.
Expression of cytokeratin, TYROBP, and PRDX1 in CTCs isolated from breast cancer patients. a Quantification of TYROBP expression (intensity per pixel) in breast cancer cell lines, Hela cells, PBMCs, and patients’ CTCs, using ARIOL system automate software. b Quantification of PRDX1 expression (intensity per pixel) in breast cancer cell lines, in Hela cells, in PBMCs, and in patients’ CTCs, using ARIOL system automate software. c Cytospins obtained from metastatic breast cancer patients were triple stained with CK (green), PRDX1(orange), and TYROBP (red) antibodies plus DAPI (blue) and analyzed with ARIOL system (magnification × 40). d Representative images from confocal laser scanning microscopy. Patients’ samples were triple stained with CK (green), TYROBP (blue), and PRDX1 (red) antibodies plus DAPI (not shown due to the absence of corresponding laser) and analyzed with confocal laser scanning microscopy (magnification × 60)

