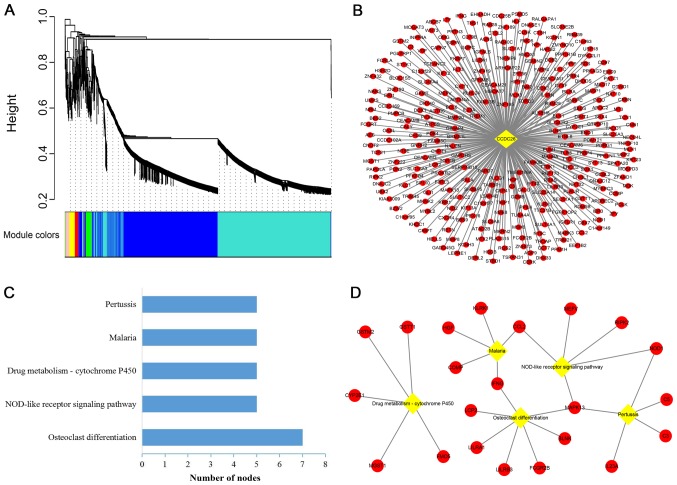
Figure 3.
Weighted gene co-expression network and pathway analysis of CCDC26 in GSE85030. (A) Cluster dendrogram built based on the dissimilarity of topological overlap, with nine module colors. The module colors under the dendrogram represent the module assignment determined by the Dynamic Tree Cut. Height represents hierarchies. (B) A co-expression network of CCDC26 and 289 mRNAs was built in the turquoise module. (C) KEGG pathway analysis of co-expressed genes of CCDC26. The bar plot indicates the number of enriched genes in the significant pathways (P<0.05). (D) Interaction and overlap of significant pathways. Diamonds represent significant pathways, and circles represent the mRNAs in the pathway. KEGG, Kyoto Encyclopedia of Genes and Genomes.

