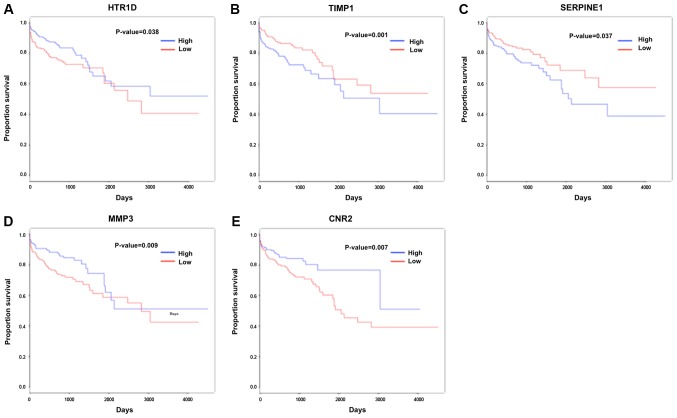
Figure 4.
Survival analyses. Kaplan-Meier survival curves for (A) HTR1D (P=0.038), (B) TIMP1 (P=0.001), (C) SERPINE1 (P=0.037), (D) MMP3 (P=0.009) and (E) CNR2 (P=0.007). Red and blue represent low and high expression groups, respectively. HTR1D, hydroxytryptamine receptor 1D; TIMP1, TIMP metallopeptidase inhibitor 1; SERPINE1, serpin family E member 1; MMP3, matrix metallopeptidase 3; CNR2, cannabinoid receptor 2.

