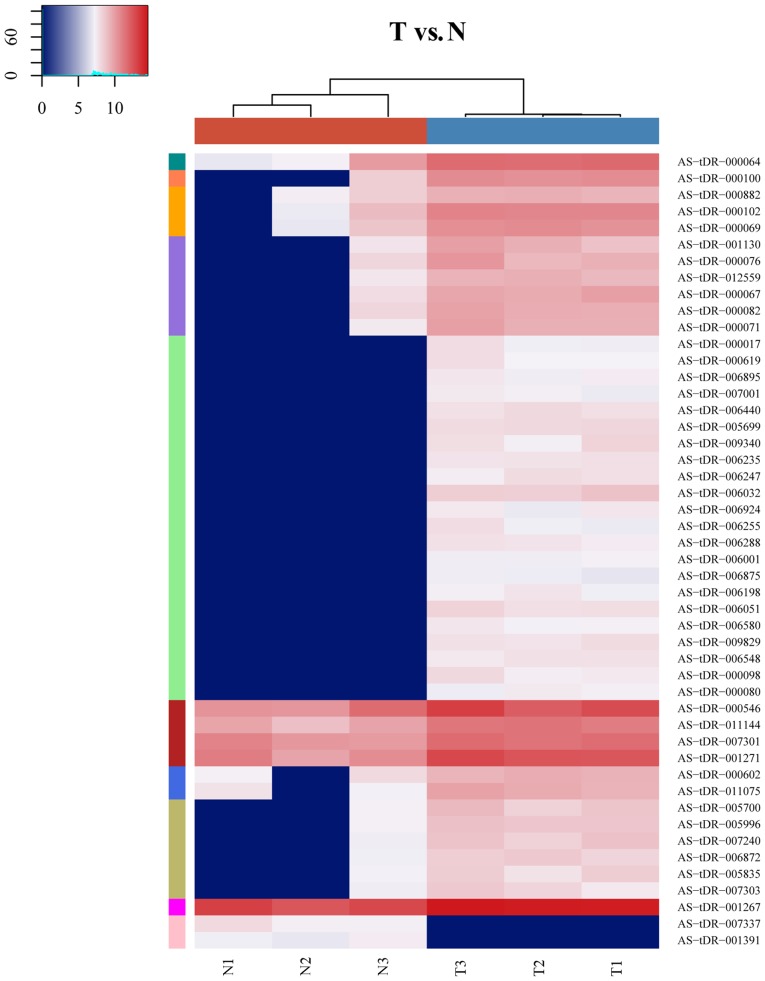
Figure 1.
Heat map indicating the expression levels of various tRFs and tiRNAs. Each square represents a gene, and its color represents the amount of expression of the gene. The higher the amount of expression, the darker the color (red is upregulated, green is downregulated). On the heatmap, dark green, dark orange, light orange, purple, green, blue, olive, magenta, pink and dark red represent low, intermediate to high tRFs and tiRNAs expression, respectively. The colors in the hatmap represent relative tRFs and tiRNAs expression as indicated in the color key. tRFs, transfer RNA-derived fragments; tiRNAs, tRNA halves; T, tumor tissue; N, normal tissue.

