Figure 1.

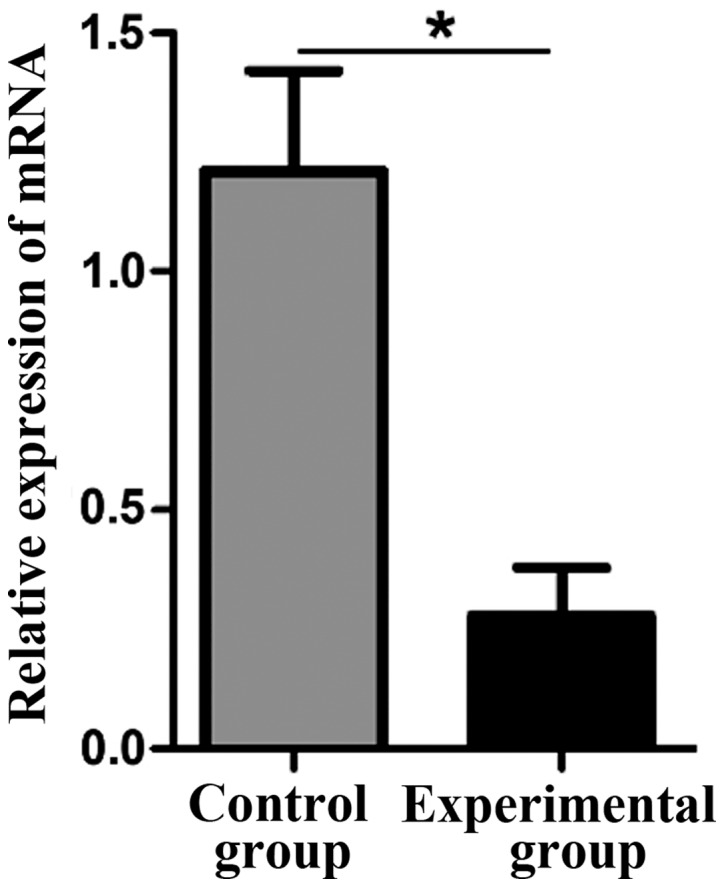
Comparison of lncRNA THOR levels between the control and experimental groups. *P<0.05 vs. the control group. lncRNA, long non-coding RNA.

Comparison of lncRNA THOR levels between the control and experimental groups. *P<0.05 vs. the control group. lncRNA, long non-coding RNA.