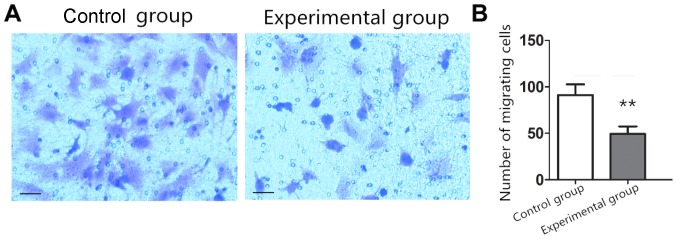
Figure 3.
Effect of lncRNA THOR on cell migration. (A) Cell migration between shRNA control group and Lenti-THOR-shRNA experimental group analyzed by Transwell. Cell enlargement, ×200. Scale bar, 20 µm. (B) Quantitative analysis of the average number of migrating cells in Fig. 2A. **P<0.01 vs. the control group. lncRNA, long non-coding RNA.

