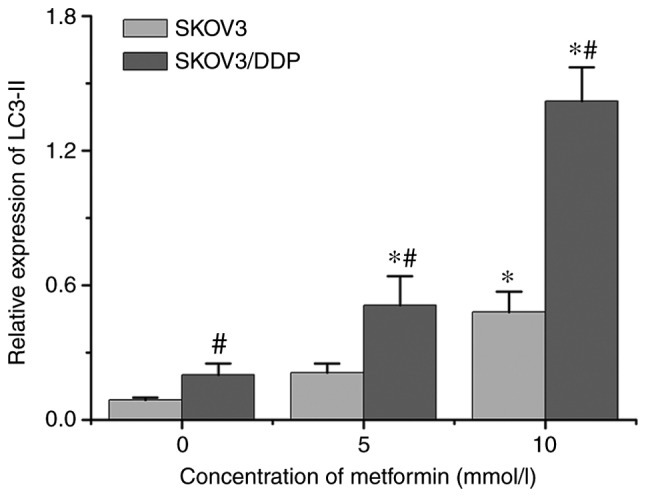
Figure 4.

Relative expression levels of LC3-II protein in SKOV3 and SKOV3/DDP cells following incubation with the indicated metformin concentrations for 48 h (mean ± standard deviation; n=3). *P<0.05 vs. 0 mmol/l metformin in the same cell type; #P<0.05 vs. SKOV3 at the same concentration. LC3-II, processed 16 kDa form of LC3; DDP, cisplatin; LC3, microtubule-associated protein 1 light chain 3.
