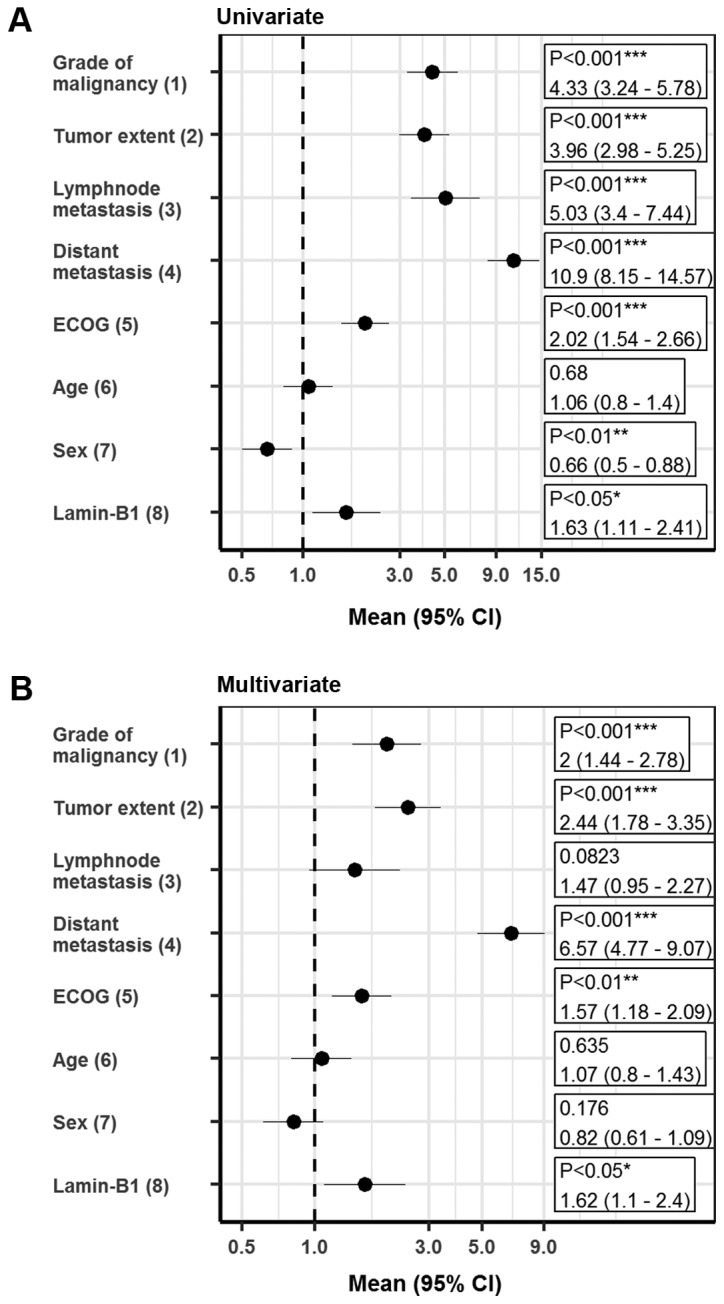
Figure 4.

Survival analysis. (A) Univariate and (B) multivariate survival analysis of prognostic factors influencing cancer-specific survival in clear cell renal cell carcinomas represented as forest plots, where the following comparisons have been applied: (1) G3 vs. G1/G2; (2) pT3/pT4 vs. pT1/pT2; (3) pN1/pN2 vs. N0/pN0; (4) M1 vs. M0; (5) ≥1 vs. 0; (6) >65 vs. ≤65%; (7) female vs. male; and (8) >60 % vs. ≤60%. *P<0.05, **P<0.01 and ***P<0.001. ECOG, Eastern Cooperative Oncology Group; CI, confidence interval.
