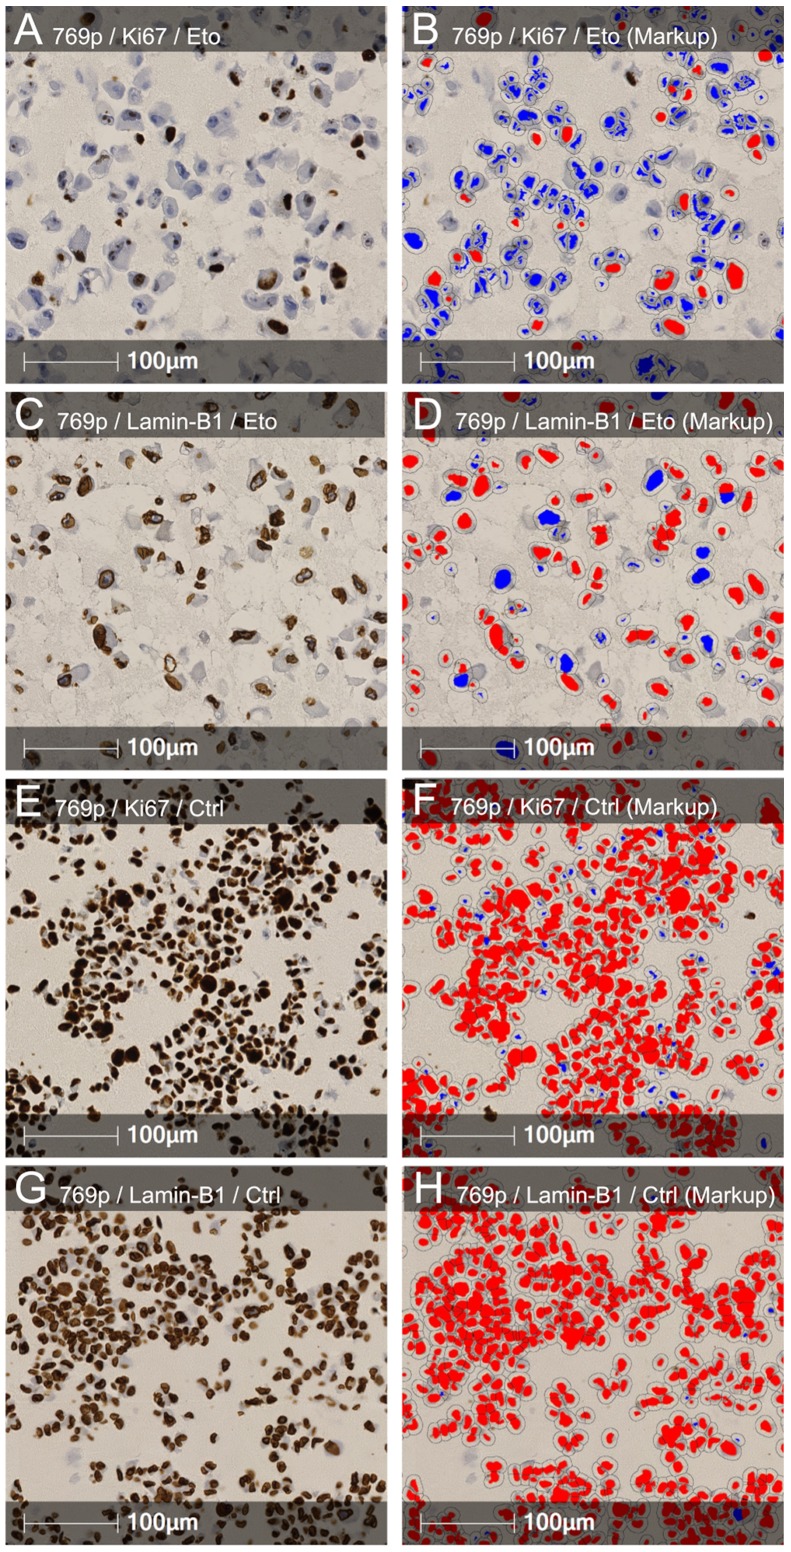
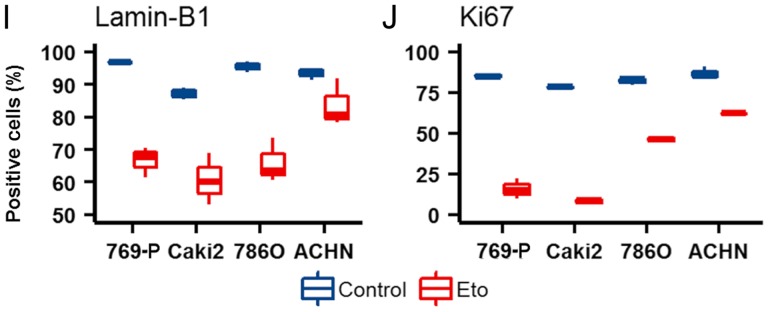
Figure 5.
Regulation of Lamin-B1 in RCC cell lines upon etoposide treatment. Representative (A and E) Ki-67 and (C and G) Lamin-B1 staining of (A and C) etoposide treated and (E and G) untreated 769-P cells. (B, D, F and H) Corresponding positive cell count markup. Blue indicates negative nuclei; and red indicates positive nuclei. (I and J) Box plots demonstrating the differences in the etoposide response in RCC cell lines. RCC, renal cell carcinoma; Eto, etoposide; Ctrl, control.


