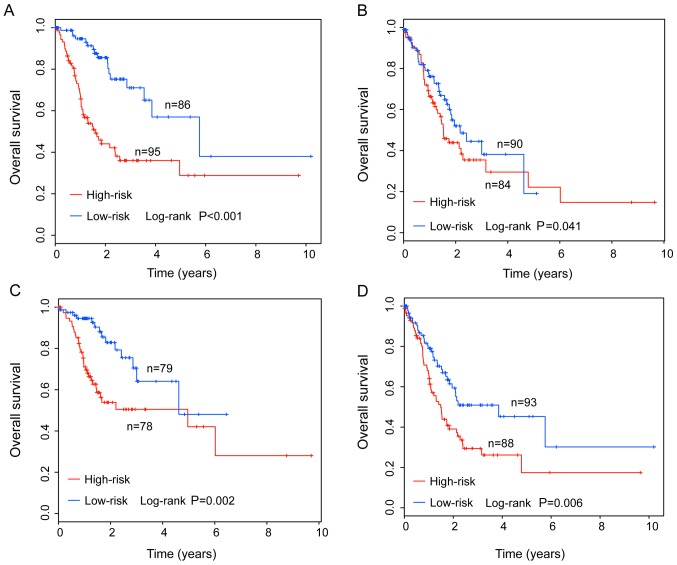
Figure 3.
Stratified analysis by age and stage. Kaplan-Meier survival curves of overall survival rates between high- and low-risk groups in (A) younger, <68 years, and (B) older, ≥68 years, patients. Kaplan-Meier survival curves of overall survival between high- and low-risk groups in (C) early-stage, I/II, and (D) advanced-stage, III/IV, patients.

